
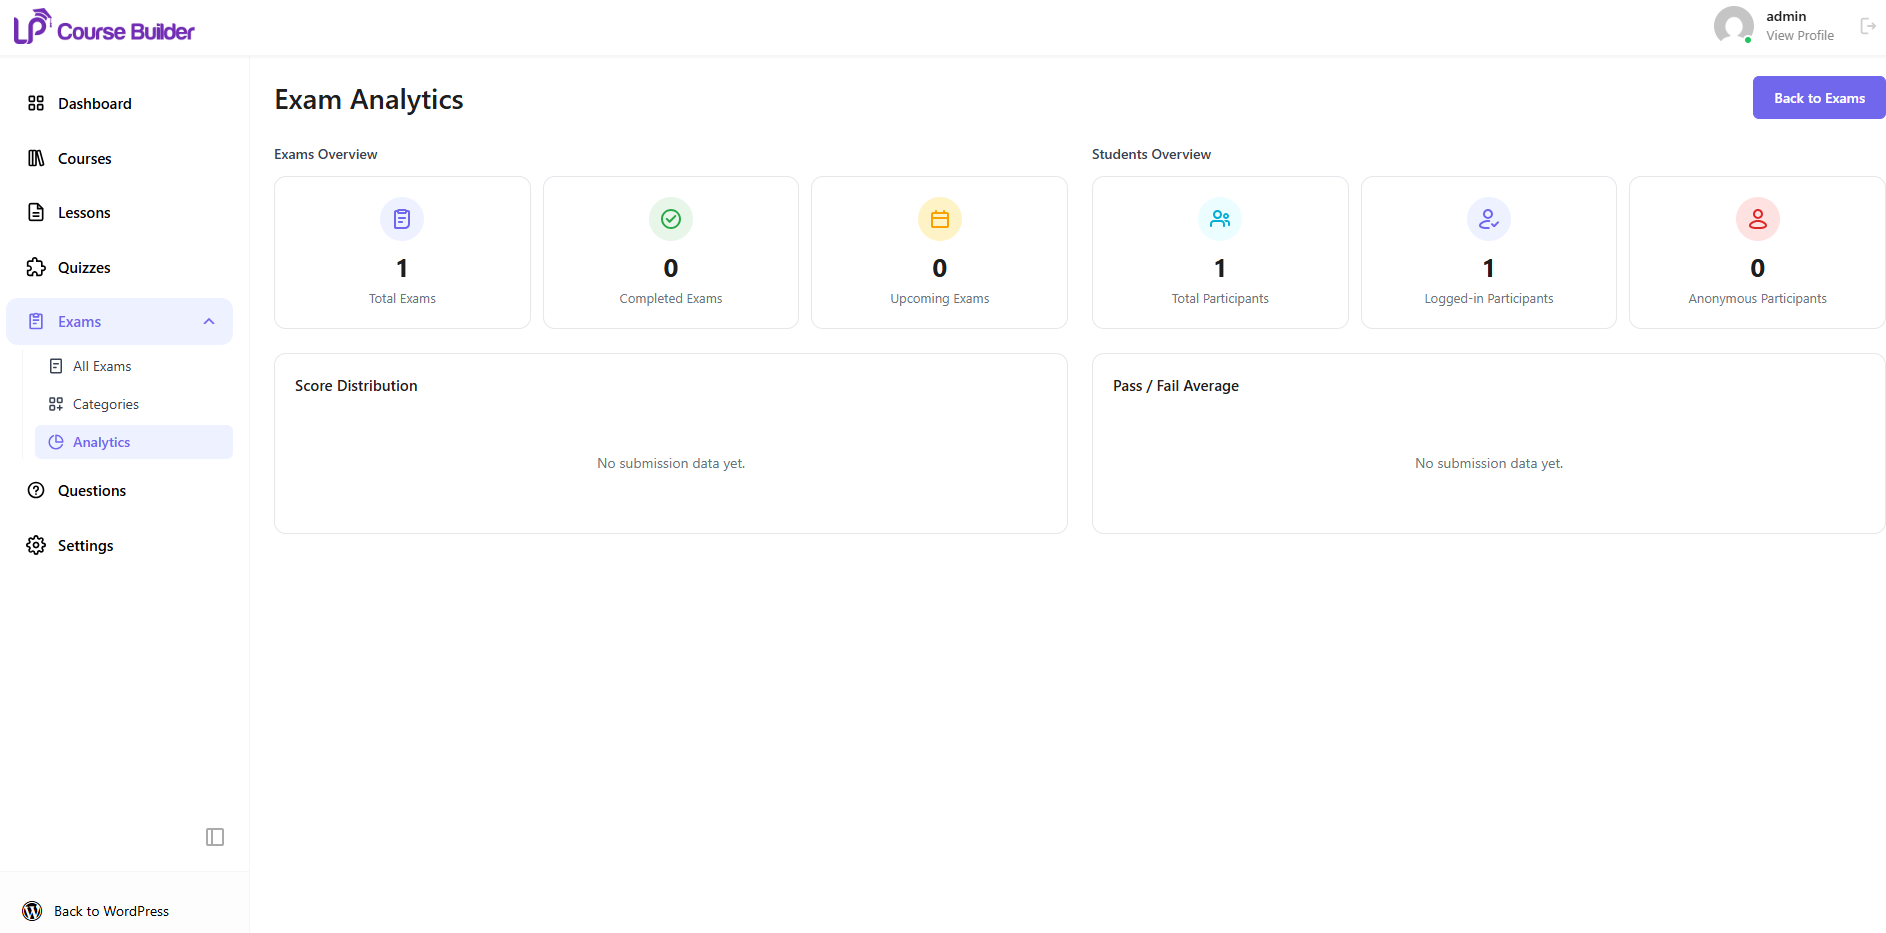
The Analytics page provides an overview of your exam performance and participation statistics. It helps instructors monitor exam activity, track student participation, and evaluate overall assessment results.
To access the analytics dashboard, navigate to LearnPress → Exams → Analytics.
The dashboard is divided into several sections, each displaying a different set of statistics.
1. Exams Overview
The Exams Overview section displays a summary of all exams on your website.
It includes the following metrics:
- Total Exams – The total number of exams that have been created.
- Completed Exams – The number of exams that have been completed by students.
- Upcoming Exams – The number of scheduled exams that have not started yet.
These statistics provide a quick overview of the current status of your exams.
2. Students Overview
The Students Overview section provides information about exam participants.
Available statistics include:
- Total Participants – The total number of students who have participated in exams.
- Logged-in Participants – The number of registered users who have taken an exam.
- Anonymous Participants – The number of guest users who have taken an exam without logging in.
This information helps instructors understand how students are accessing exams.
3. Score Distribution
The Score Distribution section displays the distribution of student scores across all exam submissions.
This chart helps instructors quickly evaluate overall student performance and identify score trends.
Note: If no submissions are available, this section will display “No submission data yet.”
4. Pass / Fail Average
The Pass / Fail Average section summarizes the overall pass and fail rates based on submitted exams.
This provides a quick overview of how students are performing and whether the exam difficulty is appropriate.
Note: This section will display data only after students have submitted their exams.